
International Equity Value Corporate Class
Class E CADFund overview
This fund invests primarily in a diversified portfolio of equity and equity-related securities of international issuers.
Fund details
| Inception date | August 2008 |
|
Total net assets ($CAD)
As at 2026-09-30
|
$736.7 million |
|
NAVPS
As at 2026-10-09 |
$19.2886 |
|
MER (%)
As at 2026-03-31 |
2.33 |
| Management fee (%) | Negotiable |
| Asset class | International Equity |
| Currency | CAD |
| Minimum investment | $250,000 initial / $25 additional |
| Distribution frequency | Annually |
| Last distribution | $0.0423 |
Risk rating2
- Low
- Low to medium
- Medium
- Medium to high
- High
Performance1 As at 2026-09-30
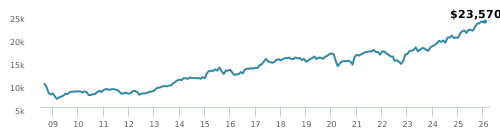
Growth of $10,000 (Since performance inception date)
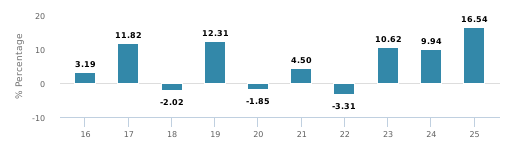
Calendar year performance
average annual compound returns
| YTD | 1 Mo | 3 Mo | 6 Mo | 1 Y | 3 Y | 5 Y | 10 Y | Inception* |
|---|---|---|---|---|---|---|---|---|
| 9.40% | -1.70% | 1.50% | 11.30% | 10.70% | 13.80% | 8.60% | 6.70% | 5.30% |
Distribution history3
| Payable date | Total |
|---|---|
| 2026-09-25 | 0.0423 |
| 2026-06-26 | 0.0431 |
| 2026-03-27 | 0.0667 |
| 2025-03-28 | 0.0916 |
| 2022-03-25 | 0.2383 |
| Payable date | Total |
|---|---|
| 2021-03-26 | 0.1028 |
| 2020-12-18 | 0.0043 |
| 2020-09-25 | 0.0044 |
| 2020-06-26 | 0.0181 |
| 2020-03-20 | 0.0183 |
CI PREFERRED PRICING4
| Investment amount | Combined fee reduction |
|---|---|
| $500,000 and above | 0.00% |
| $1,000,000 and above | 0.02% |
| $2,500,000 and above | 0.13% |
| $5,000,000 and above | 0.25% |
Management team

|
| Altrinsic Global Advisors follows a fundamental value approach to seek out high-quality undervalued companies worldwide. Altrinsic was founded by John Hock and associates. |
|
John Hock
John DeVita
Rich McCormick
|
Note: This page is not complete without disclaimers on the next page.
International Equity Value Corporate Class
Class E CAD- International Equity 94.13%
- Cash and Equivalents 4.28%
- US Equity 1.56%
- Other 0.03%
- Financial Services 34.68%
- Consumer Goods 16.03%
- Industrial Goods 12.05%
- Healthcare 11.95%
- Other 4.83%
- Industrial Services 4.75%
- Cash and Cash Equivalent 4.28%
- Energy 4.09%
- Technology 3.70%
- Consumer Services 3.64%
- Other 17.98%
- Japan 16.12%
- United Kingdom 13.81%
- Ireland 13.53%
- Germany 9.99%
- France 8.75%
- Netherlands 6.14%
- Switzerland 4.97%
- Bermuda 4.43%
- Canada 4.28%
|
Top Holdings
|
Sector | (%) |
|---|---|---|
| 1. Cash | Cash and Cash Equivalent | 4.22% |
| 2. Chubb Ltd | Insurance | 3.63% |
| 3. Deutsche Boerse AG Cl N | Asset Management | 3.12% |
| 4. Everest Group Ltd | Insurance | 2.89% |
| 5. TotalEnergies SE | Integrated Production | 2.70% |
| 6. Sony Group Corp | Consumer Durables | 2.69% |
| 7. SMC Corp | Manufacturing | 2.60% |
| 8. Suzuki Motor Corp | Automotive | 2.10% |
| 9. Gsk Plc | Drugs | 2.07% |
| 10. Sumitomo Mitsui Trust Holdings Inc | Banking | 2.05% |
| 11. Kingspan Group PLC | Construction | 1.97% |
| 12. Haleon PLC | Drugs | 1.94% |
| 13. Japan Exchange Group Inc | Asset Management | 1.93% |
| 14. Euronext NV | Asset Management | 1.93% |
| 15. Informa PLC | Media | 1.90% |
Note: This page is not complete without disclaimers on the next page.
1 Commissions, trailing commissions, management fees and expenses all may be associated with mutual fund investments. Please read the prospectus before investing. The indicated rates of return are the historical annual compounded total returns (net of fees and expenses payable by the fund) including changes in security value and reinvestment of all dividends/distributions and do not take into account sales, redemption, distribution or optional charges or income taxes payable by any securityholder that would have reduced returns. Mutual funds are not guaranteed, their values change frequently, and past performance may not be repeated.
2 The risk level of a fund has been determined in accordance with a standardized risk classification methodology in National Instrument 81-102, that is based on the fund’s historical volatility as measured by the 10-year standard deviation of the fund’s returns. Where a fund has offered securities to the public for less than 10 years, the standardized methodology requires that the standard deviation of a reference mutual fund or index that reasonably approximates the fund’s standard deviation be used to determine the fund’s risk rating. Please note that historical performance may not be indicative of future returns and a fund’s historical volatility may not be indicative of future volatility.
3 Please refer to the fund’s simplified prospectus for distribution information.
4 CI Preferred Pricing fee reductions apply to management and administration fees and start at $100,000.
5 Porfolio allocations will fluctuate over the life of the mutual fund as the portfolio holdings and market value of each security changes. The portfolio manager(s) may change the portfolio allocations in some or all of the sectors.
The contents are not to be used or construed as investment advice or as an endorsement or recommendation of any entity of security discussed.
®CI Investments and the CI Investments design are registered trademarks of CI Investments Inc. © CI Investments Inc. 2026. All rights reserved. “Trusted Partner in Wealth” is a trademark of CI Investments Inc.
Published October 2026