
U.S. Equity Growth Corporate Class
Class W CADNot available to retail investors / for approved investors only
Fund overview
This fund invests primarily in a diversified portfolio of equity and equity-related securities of U.S. issuers.
Fund details
| Inception date | October 2007 |
|
Total net assets ($CAD)
As at 2026-06-30
|
$407.3 million |
|
NAVPS
As at 2026-07-24 |
$78.1962 |
|
MER (%)
As at 2026-03-31 |
0.17 |
| Management fee (%) | Negotiable |
| Asset class | U.S. Equity |
| Currency | CAD |
| Minimum investment | $100 initial / $25 additional |
| Distribution frequency | Annually |
| Last distribution | $1.9333 |
Risk rating2
- Low
- Low to medium
- Medium
- Medium to high
- High
Performance1 As at 2026-06-30
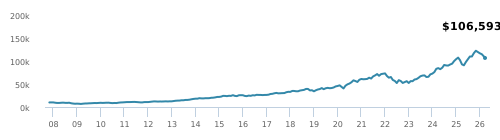
Growth of $10,000 (Since performance inception date)
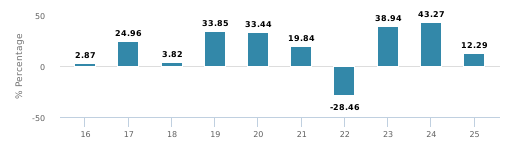
Calendar year performance
average annual compound returns
| YTD | 1 Mo | 3 Mo | 6 Mo | 1 Y | 3 Y | 5 Y | 10 Y | Inception* |
|---|---|---|---|---|---|---|---|---|
| 9.00% | 0.20% | 19.40% | 9.00% | 22.70% | 23.90% | 13.90% | 17.60% | 14.50% |
Distribution history3
| Payable date | Total |
|---|---|
| 2022-03-25 | 1.9333 |
| 2021-03-26 | 1.0430 |
| 2020-12-18 | 0.5112 |
| 2020-09-25 | 0.5215 |
| 2020-03-20 | 1.2899 |
| Payable date | Total |
|---|---|
| 2019-12-13 | 0.3389 |
| 2019-09-27 | 0.3386 |
| 2019-06-21 | 0.3328 |
| 2018-12-14 | 0.1540 |
| 2018-09-14 | 0.1485 |
Management team

|
| Wellington Management Company, LLP was founded in 1928 and provides investment management services to many of the worlds leading public and private institutions. The firm is based in Boston and is led by Vice-President and Equity Portfolio Manager Mammen Chally. |
|
Doug McLane
|
Note: This page is not complete without disclaimers on the next page.
U.S. Equity Growth Corporate Class
Class W CADNot available to retail investors / for approved investors only
- US Equity 94.05%
- International Equity 3.93%
- Cash and Equivalents 1.35%
- Canadian Equity 0.65%
- Other 0.02%
- Technology 67.20%
- Consumer Services 9.18%
- Industrial Goods 6.18%
- Healthcare 5.44%
- Financial Services 3.84%
- Consumer Goods 3.29%
- Other 1.59%
- Cash and Cash Equivalent 1.35%
- Basic Materials 1.09%
- Utilities 0.84%
- United States 93.29%
- Canada 2.49%
- Ireland 1.78%
- Cayman Islands 0.85%
- Liberia 0.85%
- Singapore 0.45%
- Other 0.29%
|
Top Holdings
|
Sector | (%) |
|---|---|---|
| 1. NVIDIA Corp | Computer Electronics | 11.83% |
| 2. Alphabet Inc Cl A | Information Technology | 9.15% |
| 3. Apple Inc | Computer Electronics | 7.59% |
| 4. Broadcom Inc | Computer Electronics | 6.17% |
| 5. Microsoft Corp | Information Technology | 4.87% |
| 6. Eli Lilly and Co | Drugs | 3.79% |
| 7. Micron Technology Inc | Computer Electronics | 3.68% |
| 8. Meta Platforms Inc Cl A | Information Technology | 3.27% |
| 9. KLA Corp | Computer Electronics | 3.00% |
| 10. Advanced Micro Devices Inc | Computer Electronics | 2.73% |
| 11. Amazon.com Inc | Retail | 2.54% |
| 12. Mastercard Inc Cl A | Diversified Financial Services | 2.35% |
| 13. Tesla Inc | Automotive | 2.17% |
| 14. General Electric Co | Diversified Industrial Goods | 1.83% |
| 15. Cash | Cash and Cash Equivalent | 1.81% |
Note: This page is not complete without disclaimers on the next page.
1 Commissions, trailing commissions, management fees and expenses all may be associated with mutual fund investments. Please read the prospectus before investing. The indicated rates of return are the historical annual compounded total returns (net of fees and expenses payable by the fund) including changes in security value and reinvestment of all dividends/distributions and do not take into account sales, redemption, distribution or optional charges or income taxes payable by any securityholder that would have reduced returns. Mutual funds are not guaranteed, their values change frequently, and past performance may not be repeated.
2 The risk level of a fund has been determined in accordance with a standardized risk classification methodology in National Instrument 81-102, that is based on the fund’s historical volatility as measured by the 10-year standard deviation of the fund’s returns. Where a fund has offered securities to the public for less than 10 years, the standardized methodology requires that the standard deviation of a reference mutual fund or index that reasonably approximates the fund’s standard deviation be used to determine the fund’s risk rating. Please note that historical performance may not be indicative of future returns and a fund’s historical volatility may not be indicative of future volatility.
3 Please refer to the fund’s simplified prospectus for distribution information.
5 Porfolio allocations will fluctuate over the life of the mutual fund as the portfolio holdings and market value of each security changes. The portfolio manager(s) may change the portfolio allocations in some or all of the sectors.
The contents are not to be used or construed as investment advice or as an endorsement or recommendation of any entity of security discussed.
®CI Investments and the CI Investments design are registered trademarks of CI Investments Inc. © CI Investments Inc. 2026. All rights reserved. “Trusted Partner in Wealth” is a trademark of CI Investments Inc.
Published July 2026